💡 Introduction
If you stumbled upon this page, chances are you’re facing issues with using ZenML. This page documents suggestions and best practices to let you debug, get help, and solve issues quickly.🔷 When to get help?
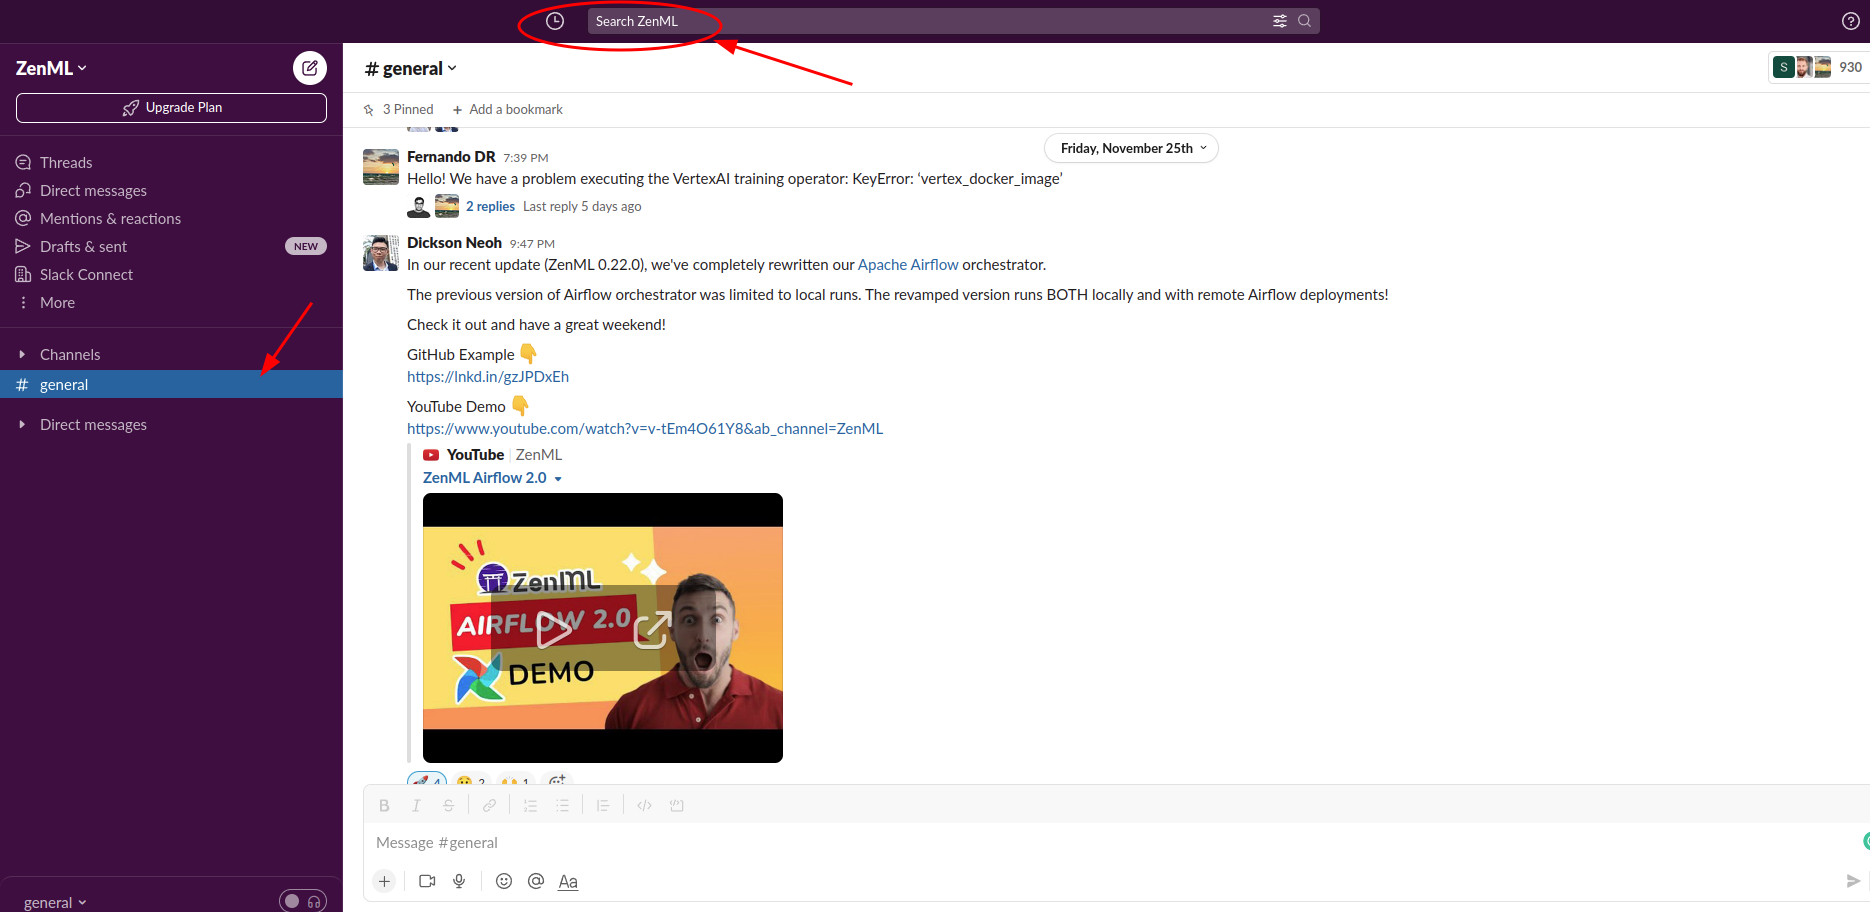
We suggest going through the following before asking for help:- Search on Slack using the built-in Slack search function at the top of the page.
- Search on GitHub issues.
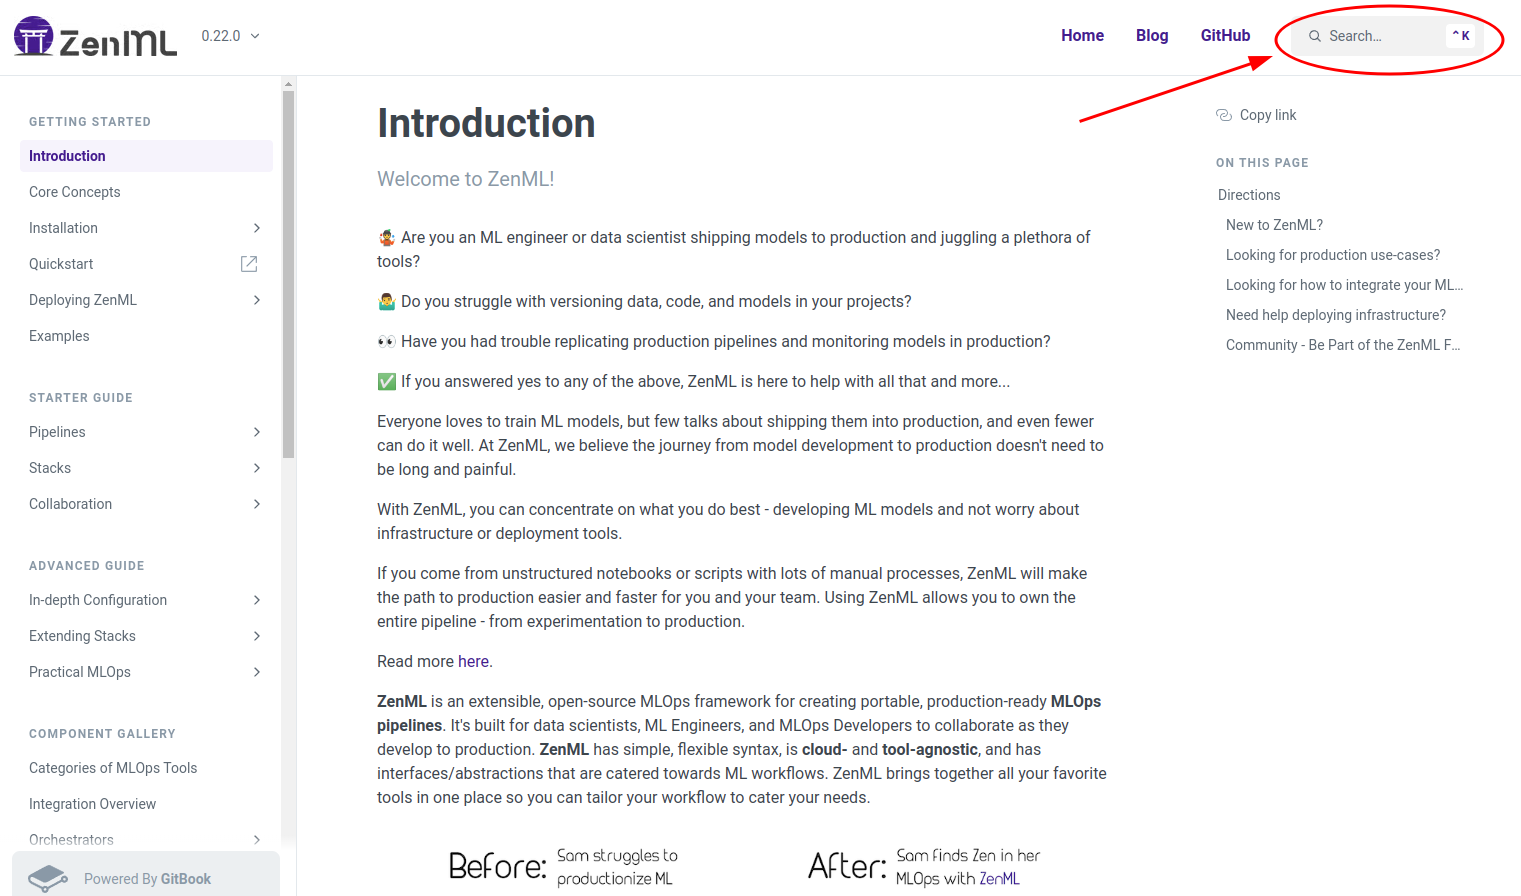
- Search the docs using the search bar in the top right corner of the page.
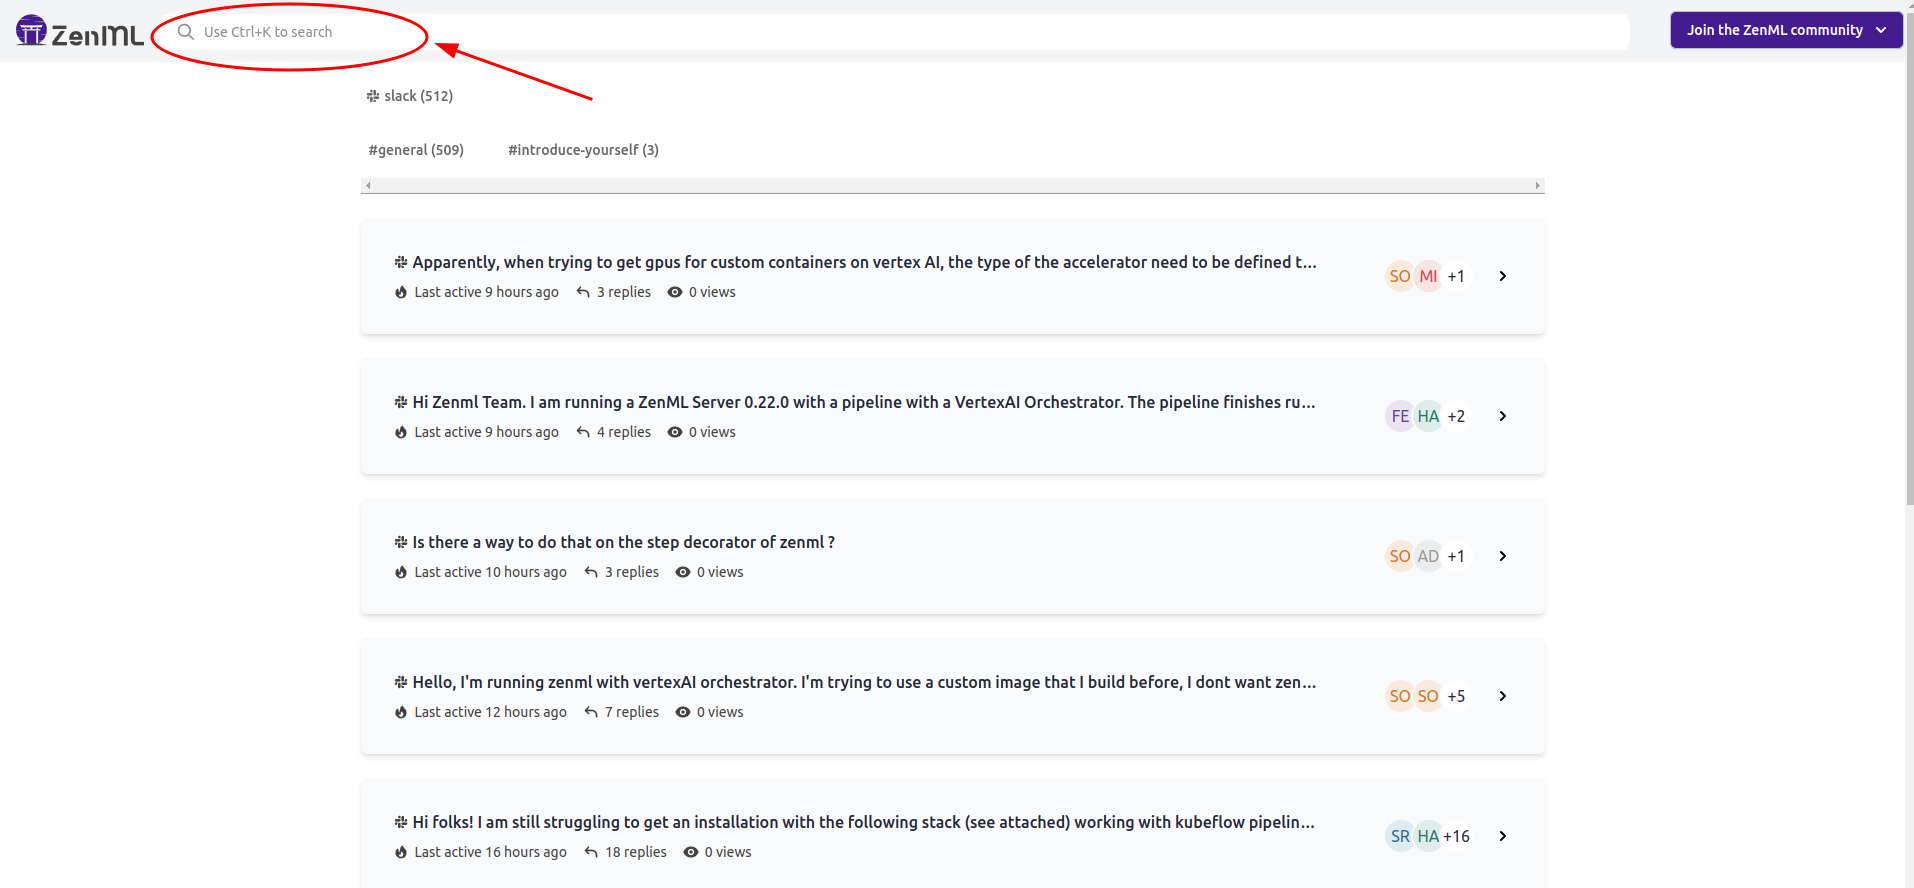
- Search on https://open.crowd.dev/zenml for issues older than 90 days on our Slack channel.
- Check out the Common errors section below.
- Understand the problem by studying the additional logs and client/server logs.
🎯 How to post on Slack?
When posting on Slack it’s useful to provide the following information (when applicable) so that we get a complete picture before jumping into solutions.1️⃣ System Information
Let us know relevant information about your system. We recommend running the following in your terminal and attaching the output to your question.2️⃣ What happened?
Tell us briefly:- What were you trying to achieve?
- What did you expect to happen?
- What actually happened?
3️⃣ How to reproduce the error?
Walk us through how to reproduce the same error you had step-by-step, whenever possible. Use the format you prefer. Write it in text or record a video, whichever lets you get the issue at hand across to us!4️⃣ Relevant log output
As a general rule of thumb, always attach relevant log outputs and the full error traceback to help us understand what happened under the hood. If the full error traceback does not fit into a text message, attach a file or use a service like Pastebin. Along with the error traceback, we recommend to always share the output of the following commands:zenml statuszenml stack describe
🔄 Additional logs
When the default logs are not helpful, ambiguous, or do not point you to the root of the issue, you can toggle the value of theZENML_LOGGING_VERBOSITY environment variable to change the type of logs shown. The default value of ZENML_LOGGING_VERBOSITY environment variable is:
WARN, ERROR, CRITICAL, DEBUG to change what’s shown in the logs. And export the environment variable in your terminal. For example in Linux:
📜 View client and server logs
When facing a ZenML Server-related issue you can view the logs of the server to introspect deeper. To see the logs of the local ZenML Server deployment run:zenml deploy, first get the pod name:
❌ Common errors
This section documents frequently encountered errors among users and solutions to each.💢 Error initializing rest store
Typically, the error presents itself as:zenml up again after each restart. Local ZenML deployments don’t survive machine restarts.
💢 Column ‘step_configuration’ cannot be null
sqlalchemy.exc.IntegrityError: (pymysql.err.IntegrityError) (1048, “Column ‘step_configuration’ cannot be null”) This happens when a step configuration is too long. We changed the limit from 4K to 65K chars, but it could still happen if you have excessively long strings in your config.💢 ‘Nonetype’ object has no attribute ‘name’
This is also a common error you might encounter when you do not have the necessary stack components registered on the stack. For example:step on line 24 expects an experiment tracker but could not find it on the stack. To solve it, register an experiment tracker of your choice on the stack. For example
💢 Install ZenML on Apple Silicon without Rosetta
Our recommended, and tested approach is to install viaRosetta.
But a community member recently discovered a way to install ZenML on Apple Silicon without Rosetta. Join the conversation here.