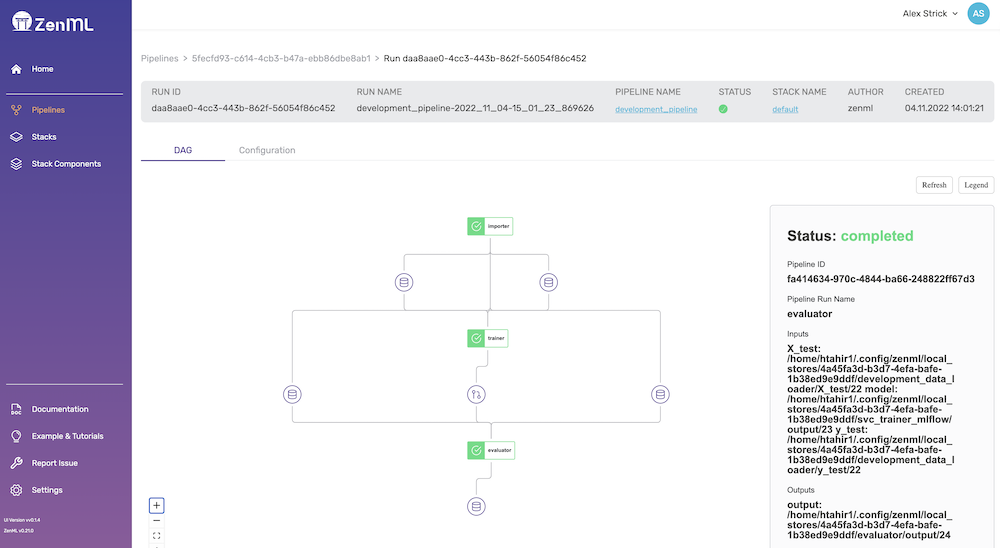
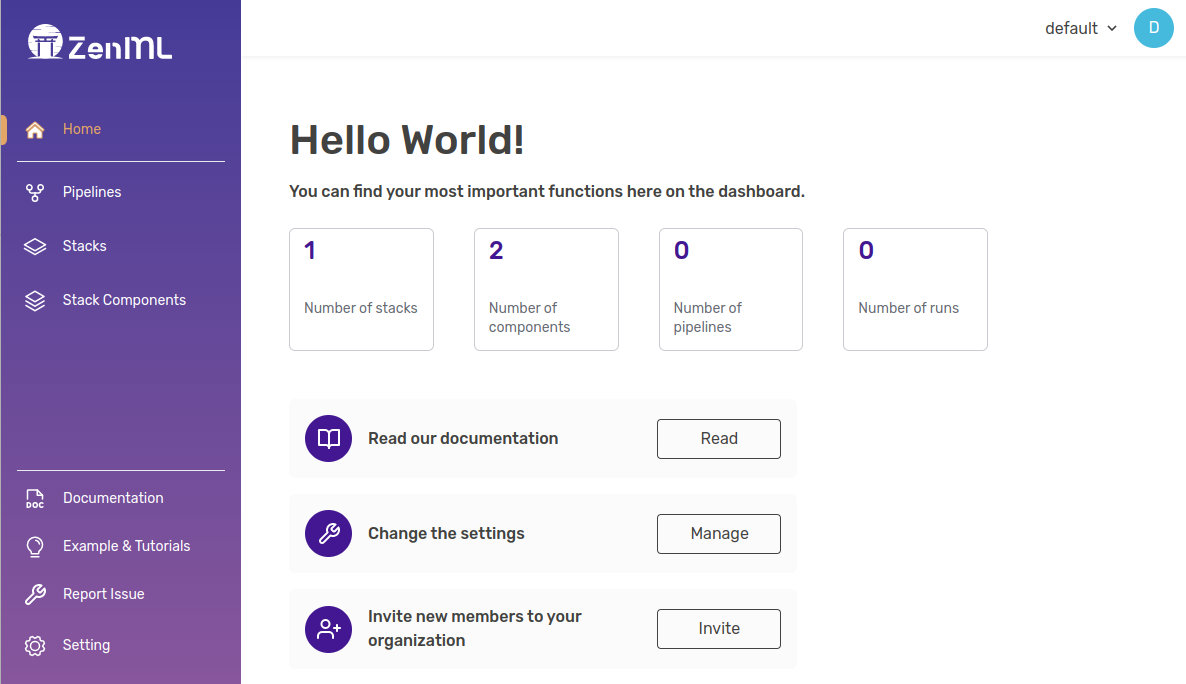
ZenML comes with a native dashboard that allows you to monitor your pipelines and their runs. It is a great way to get a quick overview of your stacks and their components, and to inspect the artifacts that were produced by your pipeline runs.Documentation Index
Fetch the complete documentation index at: https://zenml.mintlify.app/llms.txt
Use this file to discover all available pages before exploring further.
How to use it
The ZenML dashboard is served via the ZenML server. You must be connected to a local or deployed server in order to use the dashboard. The new ZenML Dashboard is now bundled into the ZenML Python package and can be launched directly from Python. The source code lives in the ZenML Dashboard repository.Local dashboard
To launch it locally, simply runzenml up on your machine and follow the instructions:
http://localhost:8237 by default:
The ZenML Server is a FastAPI application, so
can be run also directly with FastAPI using
uvicorn zenml.zen_server.zen_server_api:app --reload after cloning the
repository.Deployed dashboard
For more details on other possible deployment options, see the ZenML deployment documentation. To connect to a deployed instance of the ZenML server use thezenml connect CLI command. To connect to a ZenML server, you can either pass the configuration as command line arguments or as a YAML file:
What can you do with it
The dashboard serves as a visual interface to see pipelines, pipeline runs, stacks and stack components. It also gives you a way to inspect the artifacts produced through the pipeline runs.